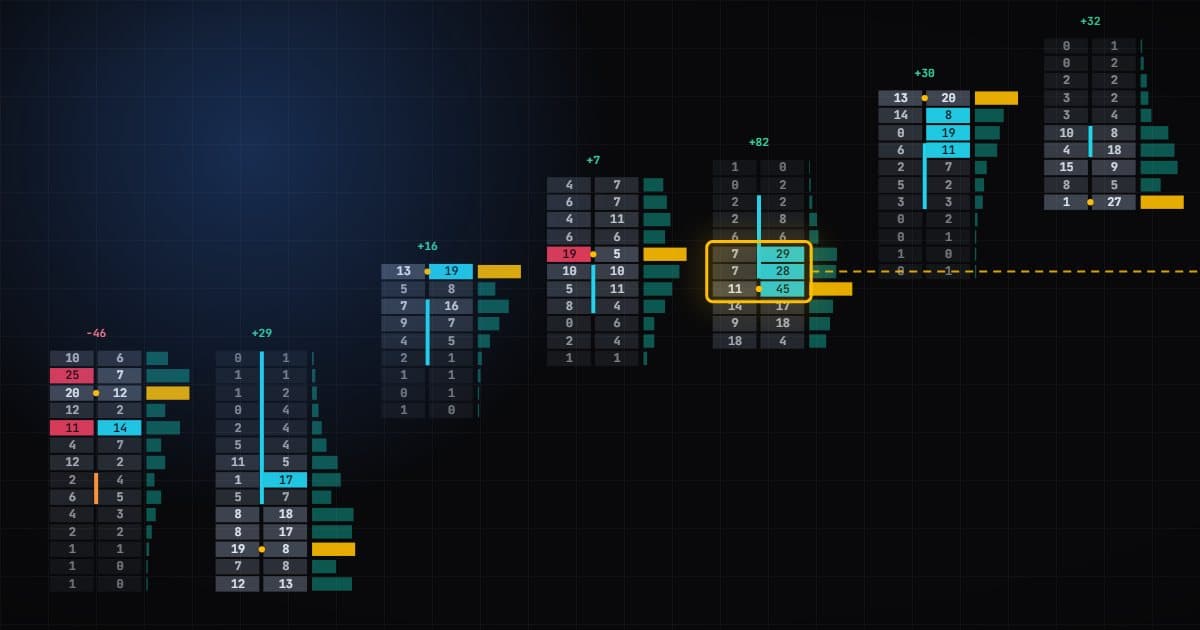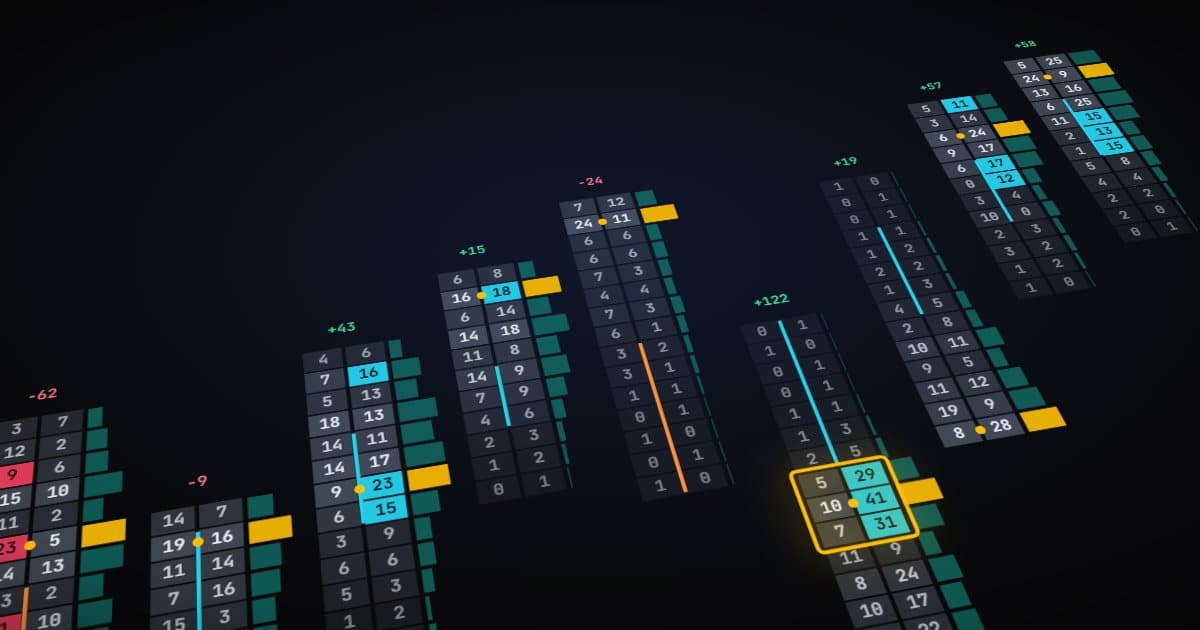
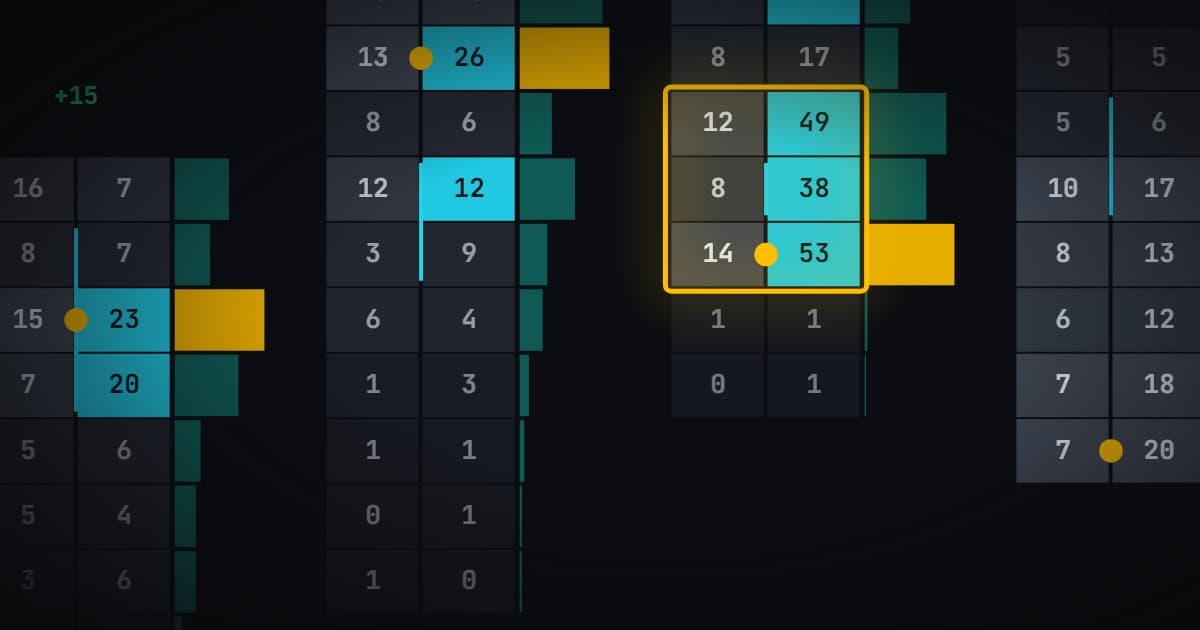
A bid/ask volume imbalance indicator highlights footprint cells where one side traded far more than the other. The highlights look obvious, but behind them sit a few small calculations and settings that change the result a lot. This article goes through that maths with real numbers.
Two ways to compare
Every footprint cell holds two numbers at one price: volume sold at the bid and volume bought at the ask. An imbalance indicator compares one of these with another. The question is which pairs.
Horizontal
Compare bid and ask at the same price. At 5,000.50: 40 sold, 130 bought, ratio 3.25. Simple, but those two numbers come from different moments in the auction.
Diagonal
Compare buying at a price with selling one tick lower, because a buyer lifting the offer at 5,000.50 is trading through sellers who were on the bid at 5,000.25. At 5,000.50: 130 bought against, say, 35 sold at 5,000.25, ratio 3.7.
For selling imbalances it runs the other way: selling at a price against buying one tick higher. Most serious footprint tools default to diagonal. Vantedge FlowPilot uses it.
The ratio threshold
A level is an imbalance when the stronger side is at least a set multiple of the weaker one. Common settings are 3:1 (300%) and 4:1 (400%).
| Ratio | Effect |
|---|---|
| Below about 2.0 | Most busy bars light up; the highlights stop meaning much |
| 2.5 to 4.0 | The usual working range for ES and NQ |
| Above 4.0 | Only extreme levels; fewer, later signals |
FlowPilot's Imbalance Ratio defaults to 3.0 with an allowed range of 1.0 to 10.0 and a suggested range of 2.5 to 4.0.
The minimum volume filter
Ratios on tiny numbers are meaningless. 4 against 1 is a 400% imbalance, and so is 400 against 100. Only the second tells you anything. A good indicator requires a minimum volume on the stronger side.
FlowPilot fixes this at 10 contracts. A level with 9 bought against 2 sold is ignored, however big the ratio.
What zero means
When the weaker side is 0, the ratio is infinite. Indicators handle this differently. Some treat any level with volume against zero as an imbalance, which floods thin prices with highlights. The minimum volume filter is what keeps this sensible: 12 against 0 counts, 3 against 0 does not.
From single imbalances to stacks
One imbalanced level is common in an active market. Several on consecutive prices, same side, are less common and more meaningful. That is a stacked imbalance.
- Stack length. FlowPilot's Stacked Requirement defaults to 3, with 2 to 4 suggested on ES and 3 to 5 on NQ, where more ticks trade per move.
- Gaps. With Allow Gap in Stacked on (the default), one level without an imbalance can sit inside a stack without breaking it. Off means stacks must be perfectly consecutive.
- Conflict. If a bar holds a bullish and a bearish stack at the same time, FlowPilot skips it.
Bar size changes everything
Imbalances are counted per bar. A 5-minute bar on NQ collects far more volume than a 1-minute bar and will show more imbalances and longer stacks. Settings tuned on one bar type do not carry over to another. Keep testing and live trading on the same bar type and size.
Indicator versus strategy
An imbalance indicator highlights cells. Vantedge Footprint does that, with configurable ratio thresholds, alongside delta shading, cumulative delta and absorption markers. It is included with both Vantedge plans rather than sold alone.
Vantedge FlowPilot goes a step further and trades the stacks: with the bar's delta agreeing, it enters at market in the direction chosen by its Follow, Fade or Auto mode, with a 16/16 tick bracket. The FlowPilot user guide shows how each imbalance setting changes trade frequency, and its Conservative, Balanced and Active profiles give you three starting points.
Highlighted cells describe what traded, not what will trade next, and futures losses can be swift. Backtest with Tick Replay and run on SIM before any evaluation, funded or live account.