01
Aggression
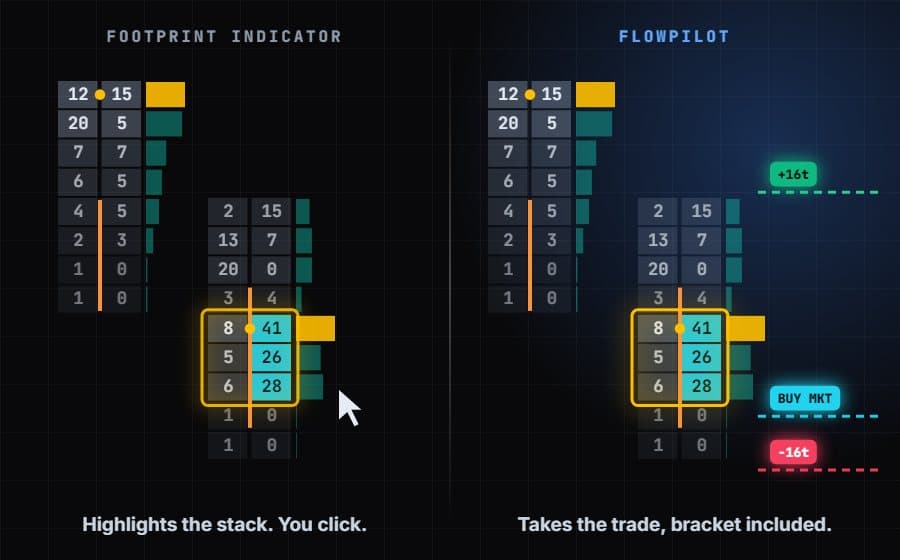
Market orders hitting the bid or lifting the ask. Who is paying up to get filled right now?
Official Strategy Guide
Spotting Phantom Liquidity & Detecting Order Book Spoofing
PDF, 10 pages, 1.1 MB. Free, no sign-up.
Introduction
Most retail traders make their decisions from time-based candlesticks, moving averages and lagging indicators such as MACD.
The problem? Time-based charts compress data. A candle gives you four prices: open, high, low and close. It hides who traded, how much traded and how aggressively they traded inside the wick.
By the time a 5-minute candle closes and your indicator crosses, faster participants have already entered, used the move to fill their orders and are getting ready to exit. You are playing a reactive game in a proactive arena.
“A candle shows you four prices. It hides every contract that traded inside it. That is where the edge lives.”
What a time-based candle hides
Who
Buyers lifting the ask or sellers hitting the bid.
How much
Traded at every single price inside the bar.
How hard
They pushed, and whether price actually moved for it.
Chapter 01
The order book is a battlefield, but it is also a stage.
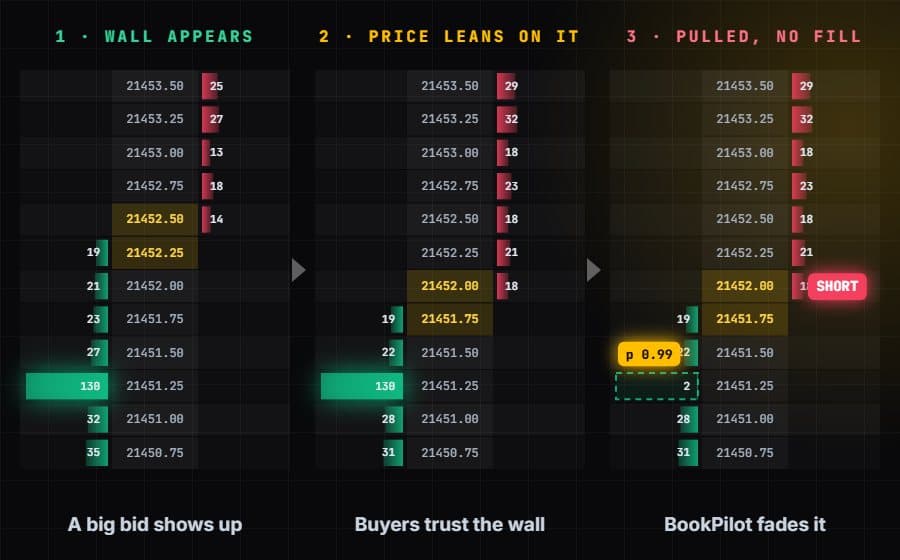
Fast algorithms routinely flash large limit orders on the book to shape what everyone else believes about support and resistance. On a standard Level 2 ladder that looks like a floor. A trader sees 500 lots resting on the bid and thinks: “The market can't drop through this. I'll buy.”
But this is phantom liquidity.
Just before price reaches that level, the order is pulled. The support vanishes, price slices through, and the stops of everyone who leaned on it are triggered, which supplies the liquidity the larger player needed for its real orders. This is spoofing. It works because most traders take the book at face value.
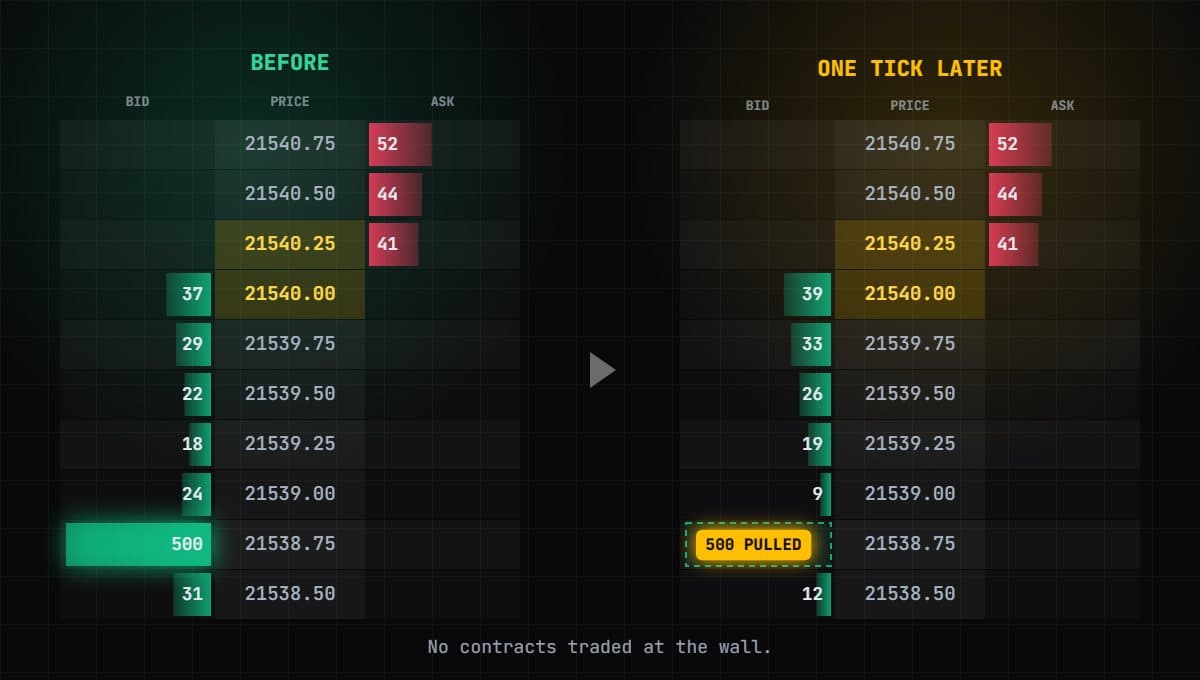
The spoof cycle
Then it repeats.
Chapter 02
How do you trade a market that bluffs? Stop trusting intent on its own and check it against execution.
Footprint charts break a candle open. Instead of four prices, you see how many contracts traded on the bid and on the ask at every price inside the bar.
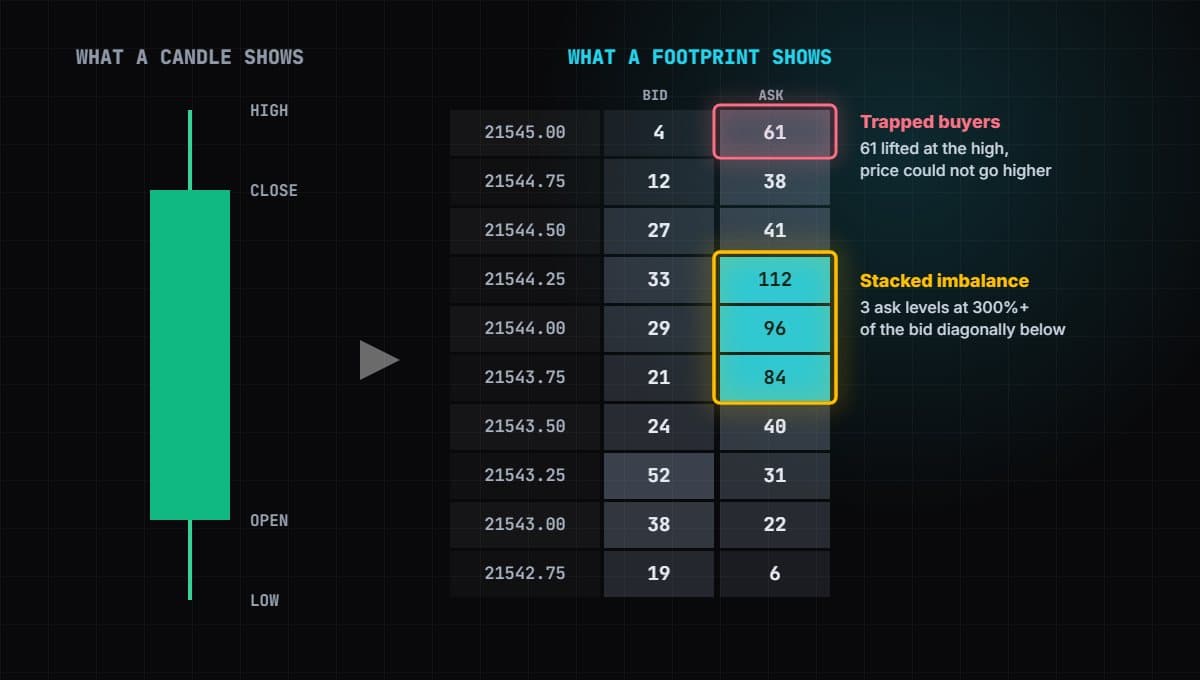
01
Market orders hitting the bid or lifting the ask. Who is paying up to get filled right now?
02
Heavy volume at the very top or bottom of a wick: traders who bought the high just before a reversal.
03
Volume drying up as price pushes into a new extreme. The move is running out of participants.
Chapter 03
A concrete way to turn phantom liquidity into a trade plan. Four steps, in order. If any step fails, there is no trade.
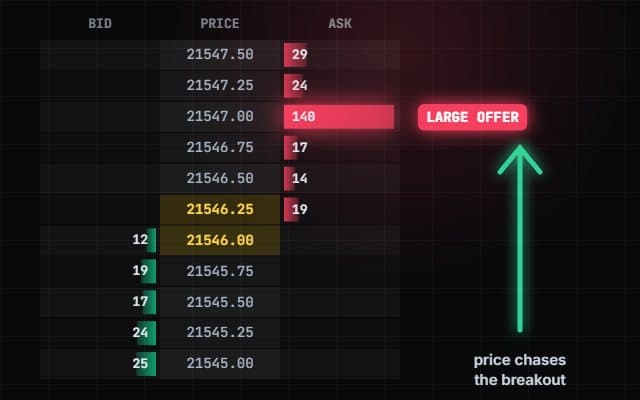
Watch the DOM for unusually large resting orders, such as heavy size offered just above price. Price accelerates toward it as traders chase the breakout.
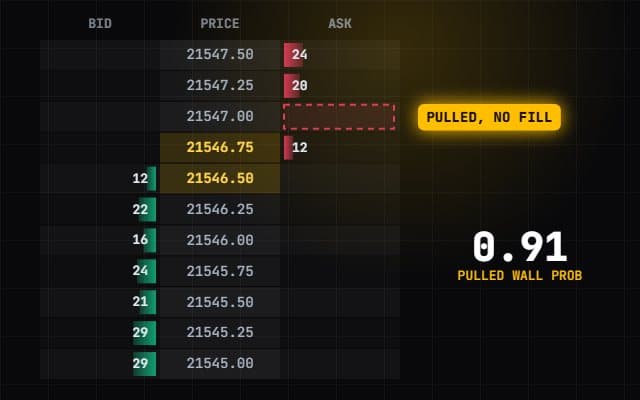
As price comes within 1 to 2 ticks, the large order disappears without trading. In BookPilot this is a Pulled Wall signal, with its own probability readout.
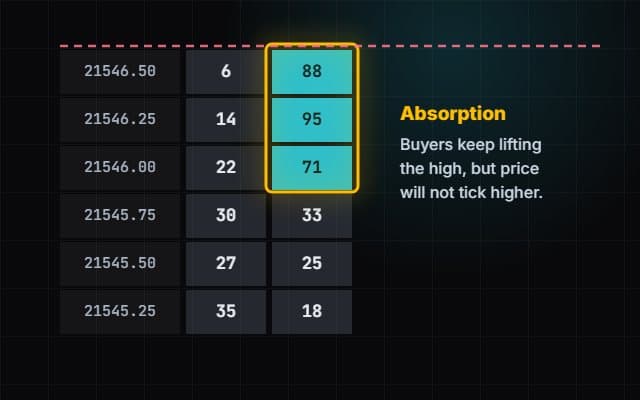
Aggressive buy orders keep hitting the highs, but price will not tick higher. That is absorption: someone is selling into the chase.
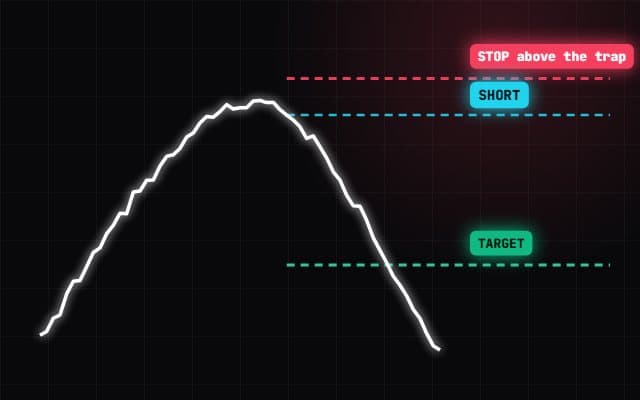
The breakout has failed. Go short with the stop just above the trapped volume node and the bracket defined before you enter.
The golden rule: trust execution over intent
The DOM shows what traders say they will do. The footprint shows what they did. When the two disagree, believe the prints, and size the trade so being wrong is a small, pre-defined loss.
Chapter 04
Most funded-account failures are not analysis failures. They are risk failures: one loss, one revenge trade at double size, and the daily drawdown is gone.
Two decisions protect you before the first trade: pick a firm whose rules fit how you trade, and make your daily limits mechanical, so they are enforced by software instead of willpower.
Daily goal
Stop while the day is good.
Daily max loss
Stop before a bad day becomes a blown account.
Cooldown after a loss
No revenge trade at double size.
Hard limits beat hard lessons.
Finale
Knowing the theory is not enough. You need tooling that sees it in real time and rules that execute it the same way every time. Both pilots run inside NinjaTrader 8, behind hard daily limits.
Not sure yet? Try FlowPilot for 7 days for $99 or compare the two.
Futures trading involves substantial risk of loss and is not suitable for every trader. The examples on this page are illustrations, not recorded trades. Spoof probabilities are diagnostics, not legal findings of manipulation. See the risk disclaimer.