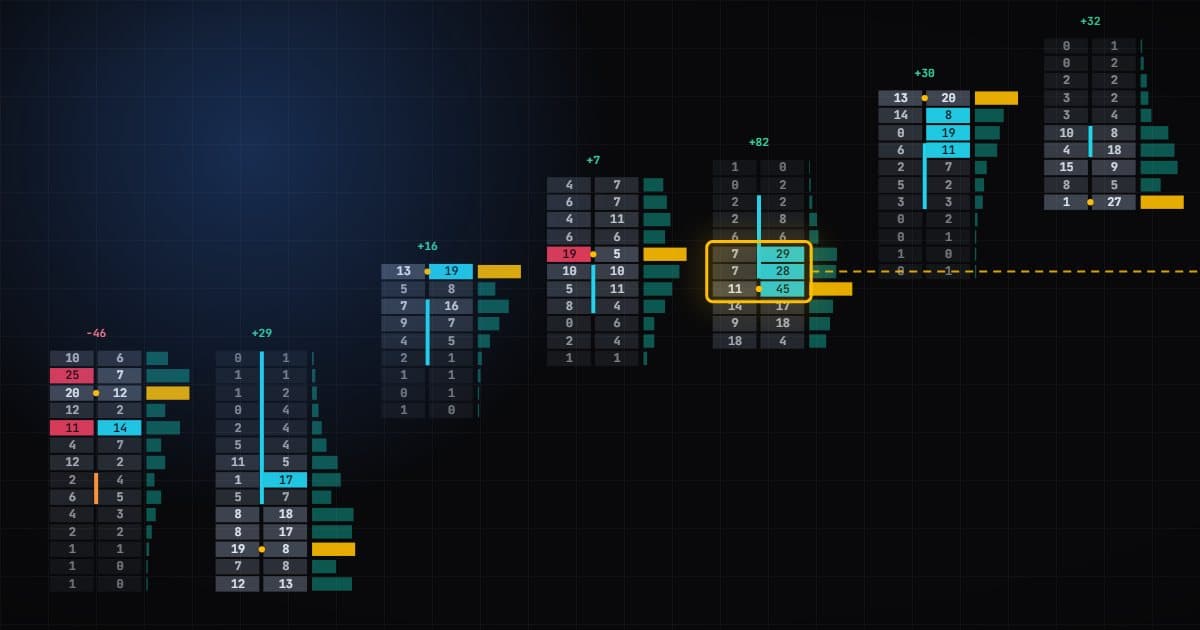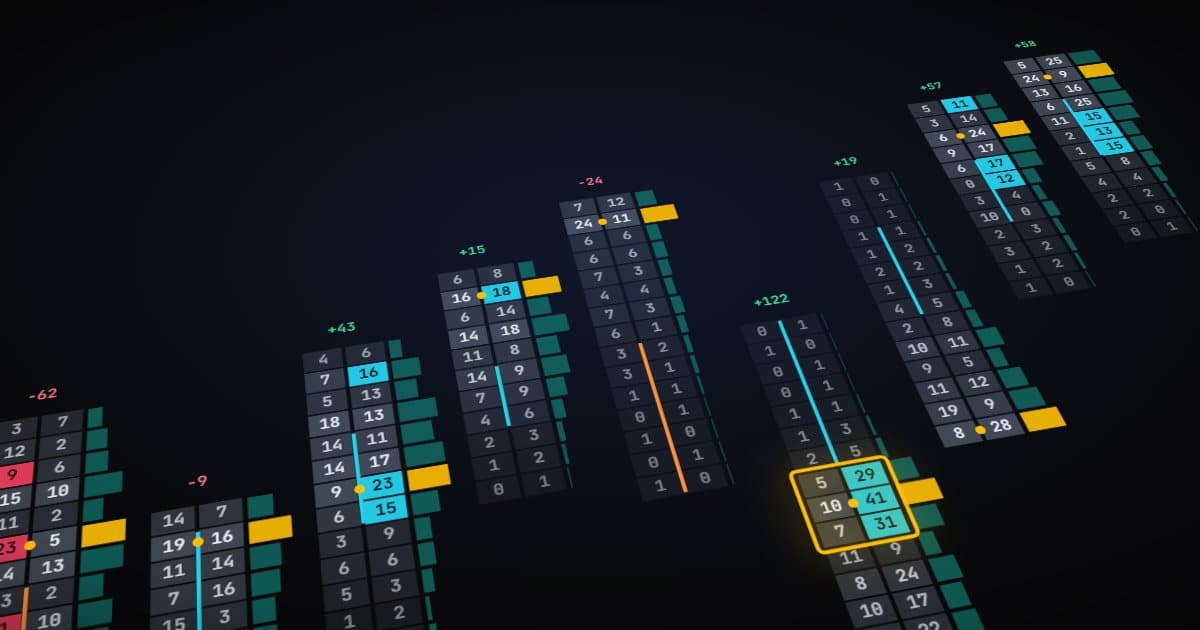
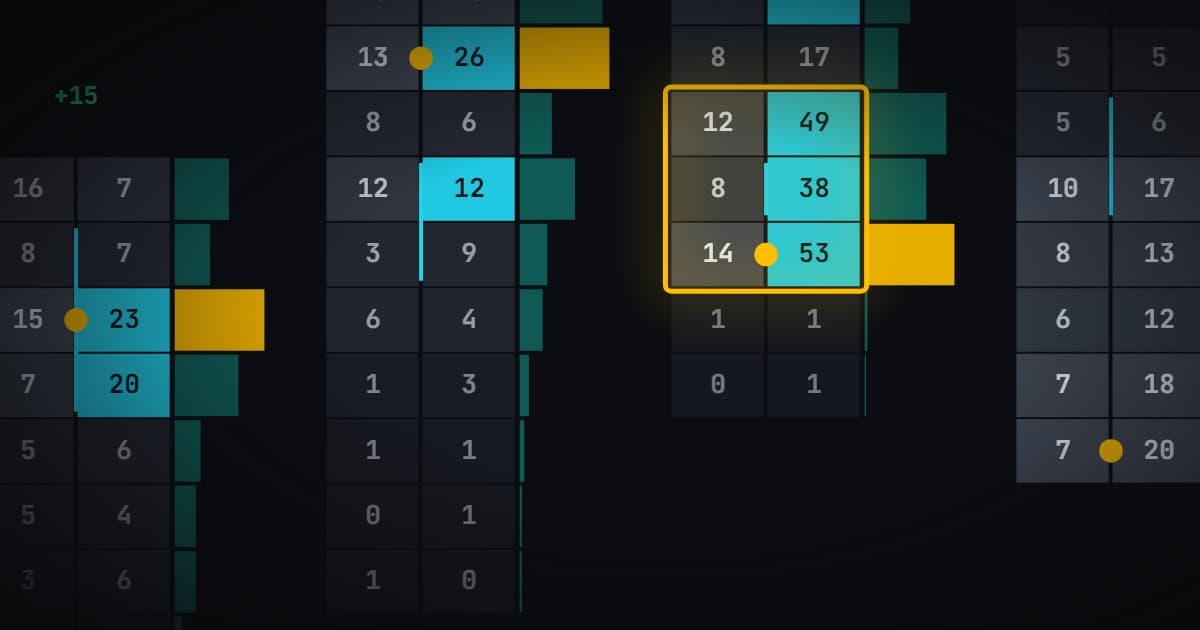
A footprint chart looks intimidating the first time: a column of numbers where a candle used to be. Once you know what each number is, it reads quickly. This tutorial sets one up in NinjaTrader 8 and then walks through a single bar, the way you would read it live.
Setting up
- Use the right data. Footprints need every trade with its bid/ask side. A tick data feed with bid/ask is enough; Level 2 is not required.
- Turn on Tick Replay. In the chart's Data Series window, tick Tick Replay. If you do not see the option, enable Show Tick Replay under Tools > Options > Market Data first. Without it, historical bars have no bid/ask detail and the footprint is empty.
- Pick a bar type and keep it. Larger bars hold more volume and show more imbalances. Compare bars of the same type and size.
- Load a footprint indicator. Vantedge FlowPilot and BookPilot users can load the Vantedge Footprint chart template (right-click the chart > Templates > Load).
Reading one bar
Here is a simplified ES bar, five prices tall. The left number is volume sold at the bid, the right number is volume bought at the ask.
| Price | Bid (sold) | Ask (bought) |
|---|---|---|
| 5,001.00 | 14 | 22 |
| 5,000.75 | 18 | 95 |
| 5,000.50 | 25 | 110 |
| 5,000.25 | 30 | 84 |
| 5,000.00 | 26 | 12 |
1. Total and delta
Add the ask column: 323 bought. Add the bid column: 113 sold. Delta is 323 minus 113, so +210. Buyers were clearly more aggressive in this bar. Vantedge Footprint shades cells by delta so you see this at a glance.
2. Diagonal imbalances
Compare buying at each price with selling one tick lower, because that is where buyers and sellers actually met.
- 5,000.75: 95 bought vs 25 sold at 5,000.50. Ratio 3.8. Imbalance at 300%.
- 5,000.50: 110 vs 30 at 5,000.25. Ratio 3.7. Imbalance.
- 5,000.25: 84 vs 26 at 5,000.00. Ratio 3.2. Imbalance.
- 5,001.00: 22 vs 18. Ratio 1.2. No imbalance.
3. Stacks
Three buying imbalances sit on consecutive prices: 5,000.25, 5,000.50 and 5,000.75. That is a stacked imbalance. Buyers pushed through three levels in a row rather than at a single price.
4. Where the push ended
At the top of the bar, at 5,001.00, buying dropped to 22. The push ran out there. On a footprint, the edge of a stack is often as informative as the stack itself.
5. Absorption
Absorption is heavy volume at a price that fails to move the market further, for example big selling at the bid at a low that holds. This bar shows none: the heaviest volume is buying in the middle of the bar, and price did move up through it. Had 5,000.00 shown 150 sold at the bid while the bar closed above it, that would be absorption. Vantedge Footprint marks absorption where it finds it.
Common mistakes
- Ignoring size. 6 against 2 is a 300% ratio but means little. Imbalances need a minimum volume; FlowPilot requires at least 10 contracts on the stronger side.
- Reading one bar in isolation. A bullish stack can be the start of a move or the last gasp of one. Context, such as cumulative delta and the previous bars, matters.
- Switching bar types. A stack on a 1-minute bar and one on a 5-minute bar are not the same signal. Pick one and learn it.
From reading to automation
The bar above is exactly the kind Vantedge FlowPilot is built around. With defaults of 3 stacked imbalances at 300% and delta that agrees with the stack, this bar qualifies. What happens next depends on the mode: Follow would buy, Fade would sell, and Auto picks based on whether the market is in a Trend or Regression regime. The order goes in at market with a 16-tick target and 16-tick stop.
The FlowPilot user guide shows every setting behind that decision, from the ratio and stack length to the bracket.
Reading a footprint well is a skill; trading it is still risky with leveraged futures. Practise in Market Replay, run any automated version on SIM, and only then move to an evaluation, funded or live account.