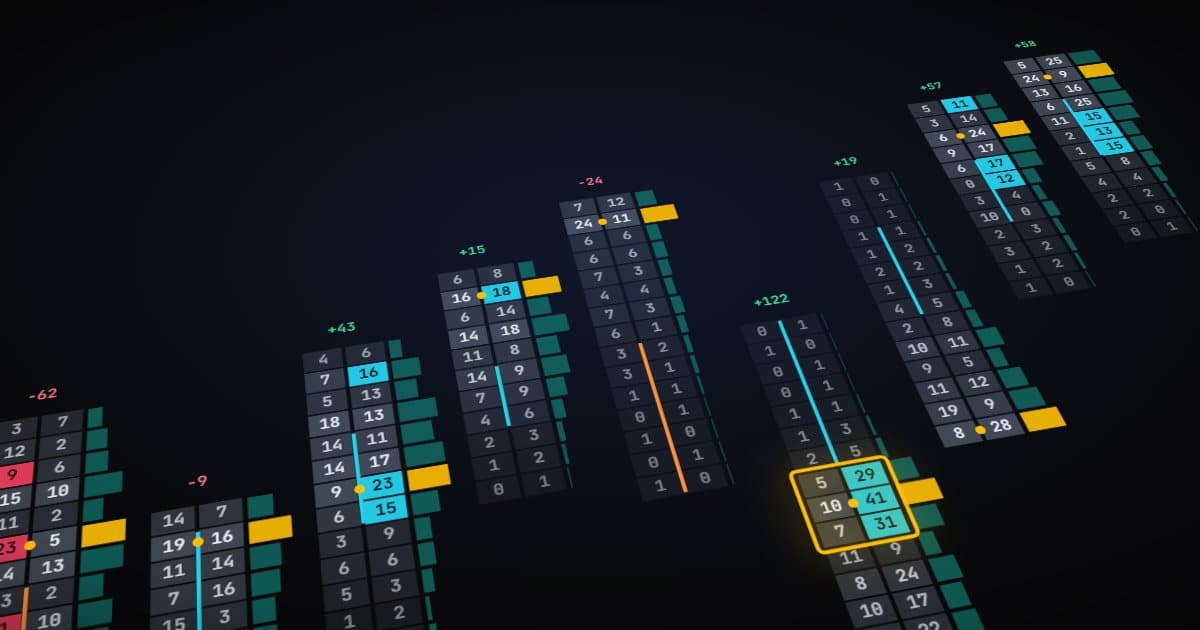
A volume profile turns a session on its side. Instead of showing volume over time, it shows how much traded at each price, as a horizontal histogram. It is one of the most popular context tools in futures, and it is often confused with the footprint chart. They answer different questions.
What a volume profile shows
Pick a period, usually one session. Add up every contract that traded at each price during it. Draw a bar at each price whose length is that total. The result shows where the market spent its time and volume, and where it moved through quickly.
Point of control
The single price with the most volume is the point of control, or POC. It marks where the most two-way business was done in the period.
Value area
The value area is the range of prices around the POC that holds a set share of the volume, most often 70%. Its edges are called the value area high and value area low.
High- and low-volume nodes
Prices with heavy volume are high-volume nodes, where the market accepted price and traded a lot. Prices with little volume are low-volume nodes, where price moved fast because few participants wanted to trade there.
Volume profile in NinjaTrader 8
NinjaTrader 8 offers volume profile tools, and many third-party versions exist. Whichever you use, the settings that matter most are similar:
- Period. One session, several sessions combined (a composite), or a custom range you anchor yourself.
- Bin size. One tick per row for detail, or several ticks grouped for a cleaner shape.
- Session template. Whether overnight trading is included changes the profile, often a lot.
- Value area percentage. 70% is common, but it is a convention rather than a law.
Like any volume tool, the profile only reflects the data loaded on the chart, so check that your history covers the period you want.
Profile versus footprint
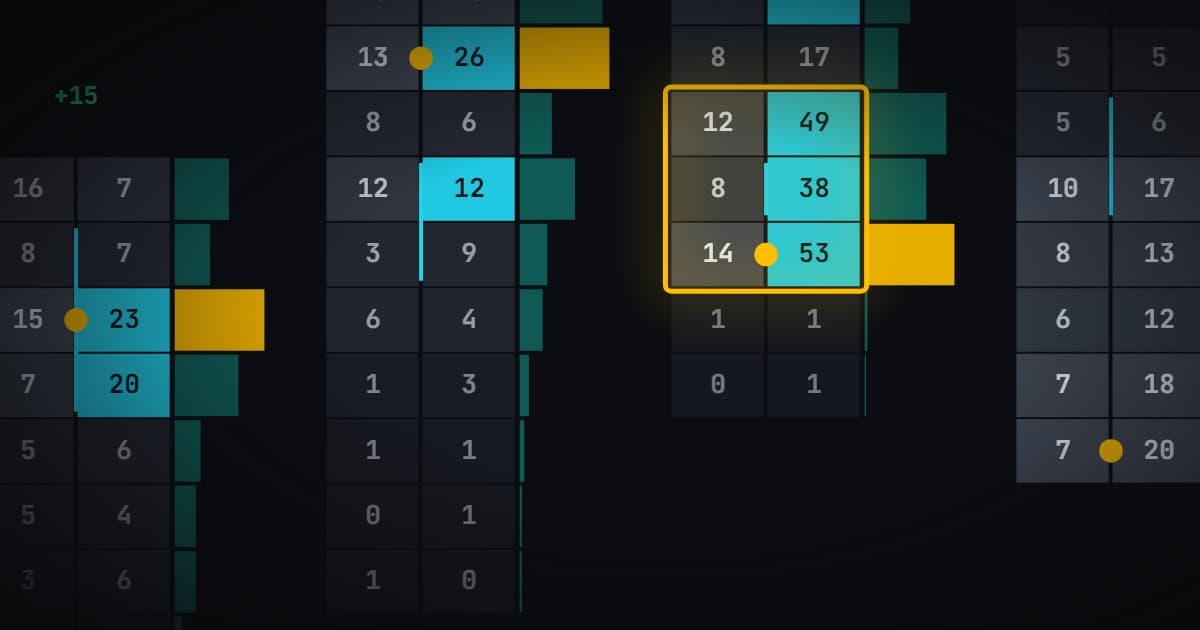
Both tools count volume by price. The difference is how they slice it.
| Volume profile | Footprint | |
|---|---|---|
| Time span | A whole session or longer | One bar |
| Volume per price | Total traded | Split into bid (sold) and ask (bought) |
| Main question | Where did the market accept price? | Who was aggressive, right now? |
| Typical use | Context and reference levels | Timing and trade triggers |
A profile tells you a level matters. A footprint tells you what happened when price got there.
Where Vantedge fits, and where it does not
To be direct: neither Vantedge strategy uses a volume profile. FlowPilot triggers on stacked bid/ask imbalances inside the footprint of the bar that is forming. It does not look at POC, value areas or volume nodes. BookPilot reads the Level 2 order book, which is a different data source altogether.
The Vantedge Footprint indicator included with both plans is a footprint tool, not a profile tool. It shows footprint cells with delta shading, cumulative delta, bid/ask imbalances and absorption markers. If you want a classic profile, use a separate profile indicator alongside it.
Using a profile as context for an automated strategy
Many traders keep a profile on the chart for their own judgement while a strategy handles the entries. A few ways to make that work:
- Directional filters. FlowPilot's Trend Long and Trend Short panel buttons block one direction. If price has been accepted well above yesterday's value area and you do not want shorts, you can switch Trend Short off.
- Choosing when to run. A session that opens inside the prior value area often rotates. One that opens far outside it may trend. FlowPilot's Auto mode reads the regime from delta and price on its own, but your profile view can inform whether you run Auto, Follow or Fade at all.
- Reviewing trades. After the session, mark FlowPilot's entries against the profile. Patterns around POC or value area edges may show up that are worth testing.
Any rule you add this way is yours, not the strategy's, so test it like any other change. The FlowPilot guide explains the panel buttons and modes, and the glossary covers profile and footprint terms.
Context tools do not lower the risk of trading futures, which can lead to significant losses. Try any profile-based filter in SIM first, before using it on an evaluation, funded or live account.